LightWork
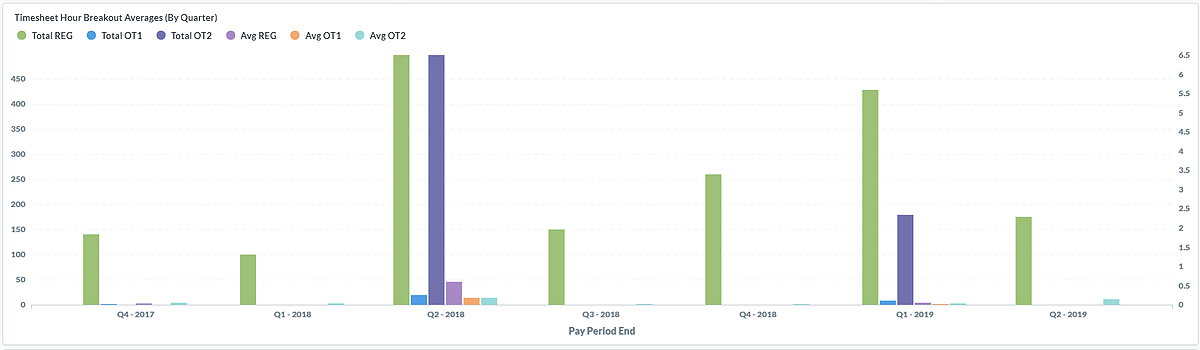
LightWork Analytics is a business intelligence tool designed to let you ask questions about your data, and display those answers in formats that make sense, whether that is a bar graph or a detailed table.
Your questions can be saved for later, making it easy to revisit them, or you can group questions into great looking dashboards. Then easily share questions and dashboards with the rest of your team.
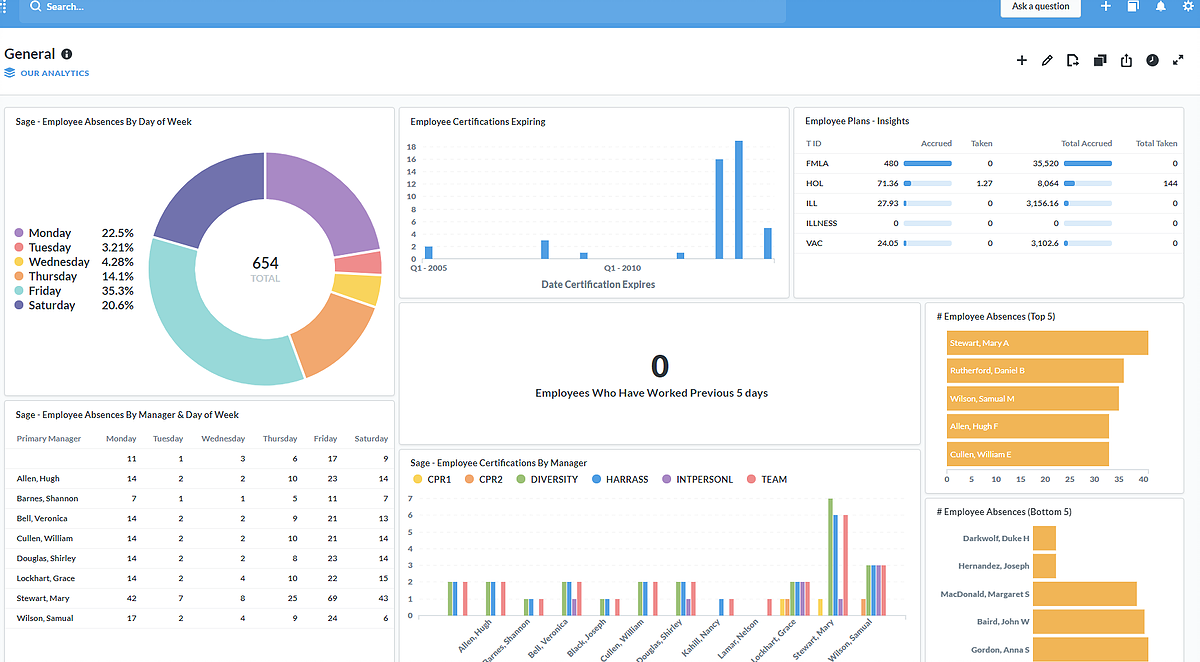
Your dashboard is a collection of saved questions that you want to refer back to and view regularly. You can do a lot with your dashboard:
There are three different kinds of alerts you can set up:
With just a few clicks of your mouse, LightWork Analytics allows you to do more with your data and identify connections effortlessly with its graphs, charts, and reporting capabilities.